Back to Home
Workflow Detail
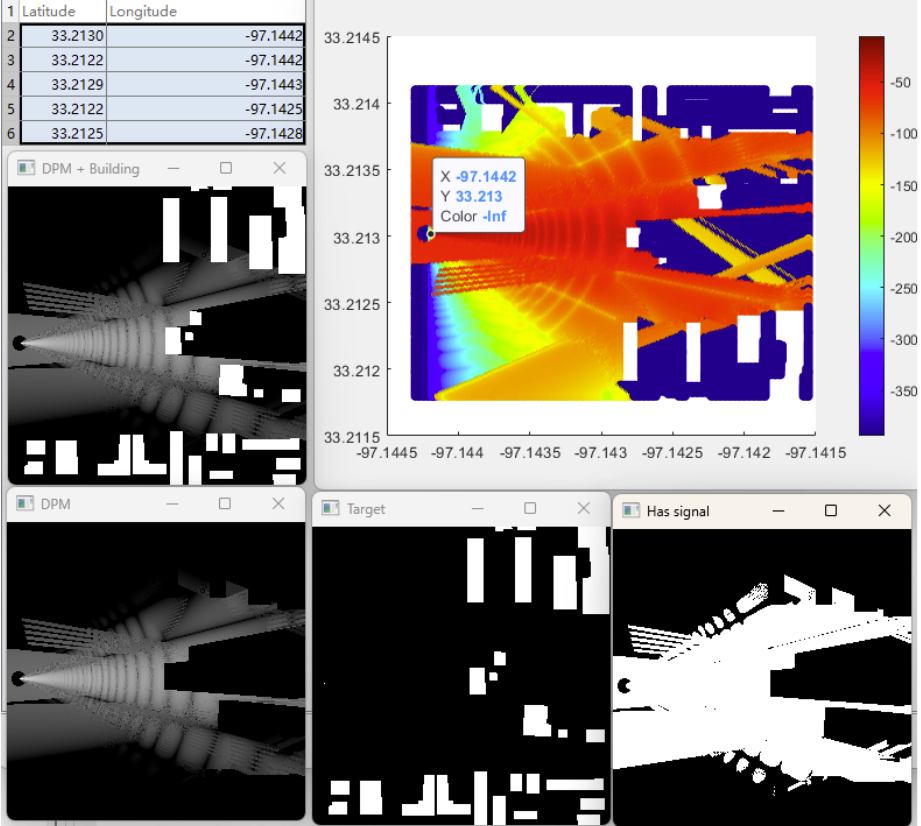
Step 3: Simulate
Compute directional patterns, region heatmaps, generated trajectories, and signal maps along active paths.
Coverage
Trajectory
Ray Tracing
Mapped MATLAB Functions
- PlotDirectivityPatternButtonPushed / PlotIdealcoverageAreaButtonPushed: antenna directivity and baseline coverage view.
- VisualizeSiteCoverageAreaButtonPushed: ray-tracing map for selected random Tx sites.
- DatasetGenerationButtonPushed + GenDatasetScript: multi-region batch dataset creation.
- GenerateTrajectory... / Fixangle / PairwiseTarget: synthetic trajectory generation and angle strategies.
- SimulateSignalAlongTrajectoryButtonPushed: per-point Tx simulation along trajectory paths.
Recommended UI Sequence
- Validate directivity pattern and site-level coverage.
- Generate or load trajectories, then select active trajectory.
- Run signal simulation along trajectory points.
- Use vehicle-variation visualization when comparing mobility models.
This step is compute-heavy and produces the data used by the final export step.
Next workflow step: export simulation artifacts.
Go to Step 4